
The first chart shows HP-filtered nominal and real GDP for the US. You're looking at percentage deviations from trend in the two time series
Marcus argues that an HP filter cannot be used to compare the Great Inflation and the Great Moderation because the mean growth rates for nominal GDP differed over the period.
Williamson's key conclusion from his graph was:
There's another interesting feature of the first chart. Note that, during the 1970s, variability in NGDP about trend was considerably smaller than for real GDP. But after the 1981-82 recession and before the 2008-09 recession, detrended NGDP hugs detrended real GDP closely. But the first period is typically judged to be a period of bad monetary policy and the latter a period of good monetary policy.
Apparently, Williamson is arguing that his graph shows that nominal GDP should vary with real GDP. Imagine that real GDP is varying because of changes in potential output. Assuming prices (and wages) are perfectly flexible, real output is always equal to potential output. By varying nominal GDP with these shifts in potential output, the price level remains stable (or at least on a stable growth path.).
In the seventies, on the other hand, when potential output varied, due to changes in how much people want to work or changes in productivity due to changes in the availability of energy, nominal GDP failed to adjust enough. Rather than tracking real GDP, it varied less. Again, assuming perfectly flexible prices and wages, the result was undesirable fluctuations in inflation.
The continuous market clearing, real business cycle approach, makes it all so simple. Real output always equals potential output, the unemployment rate always equals the natural unemployment rate, and the quantity of money, the demand to hold money, and nominal GDP only impact inflation and the price level.
But, of course, the problem with the Great Inflation wasn't wide swings in inflation (with some deflation in there too.) The problem with the GREAT INFLATION was accelerating inflation. And it wasn't that potential output shank over the decade or even that its growth rate was especially slow. As Nunes shows, the reason was simple. Nominal GDP grew at an accelerating rate.
What was learned by mainstream economists during the period was that accelerating nominal GDP growth does not generate a perpetual boom along with the higher inflation. At least at higher inflation rates, there doesn't appear to be a long run phillips curve.
My view is that there were serious supply shocks during the seventies, including two related to oil markets. (I doubt that this resulted in much change in how much people wanted to work.) If nominal GDP had shifted more, to prevent the supply shocks from causing spikes in inflation, then the reduction in real GDP would have been more. If nominal GDP had shifted less, so that the spikes in inflation were worse, the shift in real GDP would have been smaller.
However, none of these judgments about the fluctuations in real GDP and nominal GDP in any way justify the accelerating trend in nominal GDP growth. This is clearly shown by Nunes:
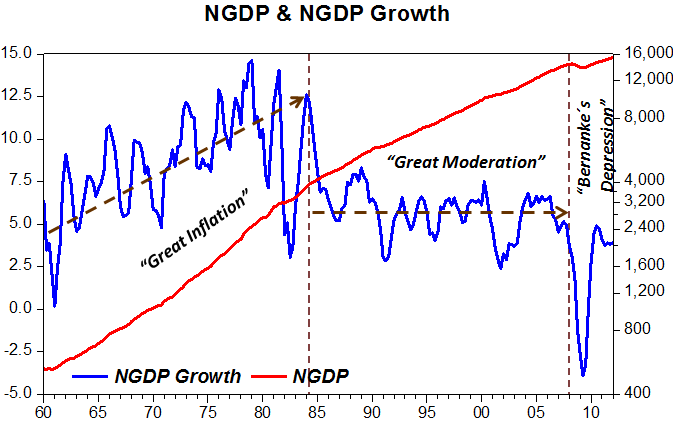
The problem in the seventies was accelerating inflation. That is why the Fed's second big failure is called the "Great Inflation." It was a failure, but of a different sort than the previous one, which is called "The Great Depression," or the later one, called "The Great Recession."
No comments:
Post a Comment